How to Reverse Engineer Stripped Binaries Easily Using GDB

During in the process of reverse engineering binaries, a common problem arises. How do I reverse engineer stripped binaries? There are no symbols to break on, offsets change, scripts don't work, and you ask yourself why am I doing this? Luckily there are many tricks to make this easier and to keep yourself sane. In this article, I will be discussing how to use imagebase offsets to easily debug stripped binaries.
Prerequisites
Source Code
This is the source code that I will be debugging:
  1 #include <stdio.h>
  2 #include <string.h>
  3 #include <stdlib.h>
  4
  5 void init() {
  6     setvbuf(stdout, 0, 2, 0);
  7     setvbuf(stdin, 0, 2, 0);
  8 }
  9
 10 void win() {
 11     system("/bin/sh");
 12 }
 13
 14 int main() {
 15     int isValid;
 16     char password[] = "password";
 17     char input[100];
 18
 19     printf("Guess my password!\n");
 20     scanf("%99s", input);
 21
 22     isValid = strcmp(input, password);
 23     if (isValid == 0) {
 24         printf("Access granted!\n");
 25         win();
 26     } else {
 27         printf("Access denied.\n");
 28     }
 29
 30     return 0;
 31 }
To strip this file you can either:
Strip it while compiling:
gcc simple-pwn.c -o simple-pwn.o -sStrip the output binary:
strip simple-pwn.o
To check if the binary is stripped, you can use the file command:
[user@myarch]$ file simple-pwn.o
simple-pwn.o: ELF 64-bit LSB pie executable, x86-64, version 1 (SYSV),
dynamically linked, interpreter /lib64/ld-linux-x86-64.so.2,
BuildID[sha1]=a06a70a06059d4f98e06171bc39ffb3a9ad667eb,
for GNU/Linux 4.4.0, stripped
Turning off ASLR
ASLR (Address Space Layout Randomization) is a security feature that randomizes memory addresses to make it harder to exploit vulnerabilities. This can be frustrating in gdb when you try to access memory addresses that no longer exist. ASLR is enabled in gdb when the setuid bit (which allows the binary to execute with the privileges of its owner) is set to true. This is common with remote desktops that you connect to; however, it's not always necessary to disable ASLR.
a) Turning off ASLR on a particular file
To disable the setuid bit on a file, either:
Direct Permission Change:
chmod u-s filenamecopy it into /tmp:
cp ./filename /tmp/filename
b) Turning ASLR off system wide (sudo permission)
The value of /proc/sys/kernel/randomize_va_space controls ASLR on your system. The command below will temporarily disable ASLR until the next restart.
echo 0 > sudo /proc/sys/kernel/randomize_va_space
The following options:
0: disabled
1: Conservative: Shared libraries and PIE binaries are randomized.
2: Conservative and start of brk area is randomized.
To turn ASLR back on:
echo 2 > sudo /proc/sys/kernel/randomize_va_space
c) Turning off ASLR while using pwntools with GDB
pwntools is a python module that greatly aids in reverse engineering and binary exploitation. However it does load ASLR automatically even if the setuid bit is false. Fortunately, there's a parameter that disables ASLR.
>>> from pwn import *
>>> filename = '/tmp/simple-pwn.o'
>>> gdb.debug(filename,aslr=False)
Adding the Base Address to GDB
When ASLR is turned off, the base address of any binary will be fixed at 0x0000555555554000. To set this as a variable in GDB, execute the following command:
(gdb) set $BASE = 0x0000555555554000
I highly recommend adding this line to your ~/.gdbinit file to ensure it's set every time you run gdb.
echo 'set $BASE = 0x0000555555554000' >> ~/.gdbinit
This will be used heavily in the next section.
Using offsets
You can break at specified points in the code of a binary if you know the offset to the instructions.
Finding Offsets
a) GDB
Using GDB's built-in functions, you can find the entry address offset before the binary has run:
(gdb) info file
Symbols from "/tmp/simple-pwn.o".
Local exec file:
    `/tmp/simple-pwn.o', file type elf64-x86-64.
    Entry point: 0x1090
    0x0000000000000318 - 0x0000000000000334 is .interp
    0x0000000000000338 - 0x0000000000000378 is .note.gnu.property
    0x0000000000000378 - 0x000000000000039c is .note.gnu.build-id
    0x000000000000039c - 0x00000000000003bc is .note.ABI-tag
    0x00000000000003c0 - 0x00000000000003e8 is .gnu.hash
    0x00000000000003e8 - 0x0000000000000538 is .dynsym
    0x0000000000000538 - 0x000000000000061c is .dynstr
    0x000000000000061c - 0x0000000000000638 is .gnu.version
    0x0000000000000638 - 0x0000000000000688 is .gnu.version_r
    0x0000000000000688 - 0x0000000000000778 is .rela.dyn
    0x0000000000000778 - 0x0000000000000808 is .rela.plt
    0x0000000000001000 - 0x000000000000101b is .init
    0x0000000000001020 - 0x0000000000001090 is .plt
    0x0000000000001090 - 0x0000000000001296 is .text
    0x0000000000001298 - 0x00000000000012a5 is .fini
    0x0000000000002000 - 0x0000000000002043 is .rodata
    0x0000000000002044 - 0x0000000000002078 is .eh_frame_hdr
    0x0000000000002078 - 0x0000000000002134 is .eh_frame
    0x0000000000003dd0 - 0x0000000000003dd8 is .init_array
    0x0000000000003dd8 - 0x0000000000003de0 is .fini_array
    0x0000000000003de0 - 0x0000000000003fc0 is .dynamic
    0x0000000000003fc0 - 0x0000000000003fe8 is .got
    0x0000000000003fe8 - 0x0000000000004030 is .got.plt
    0x0000000000004030 - 0x0000000000004040 is .data
    0x0000000000004040 - 0x0000000000004060 is .bss
From here you can find where the instructions are stored, by looking at the offset at 'Entry Point: 0x1090'. The instruction offset's of the binary can now be found:
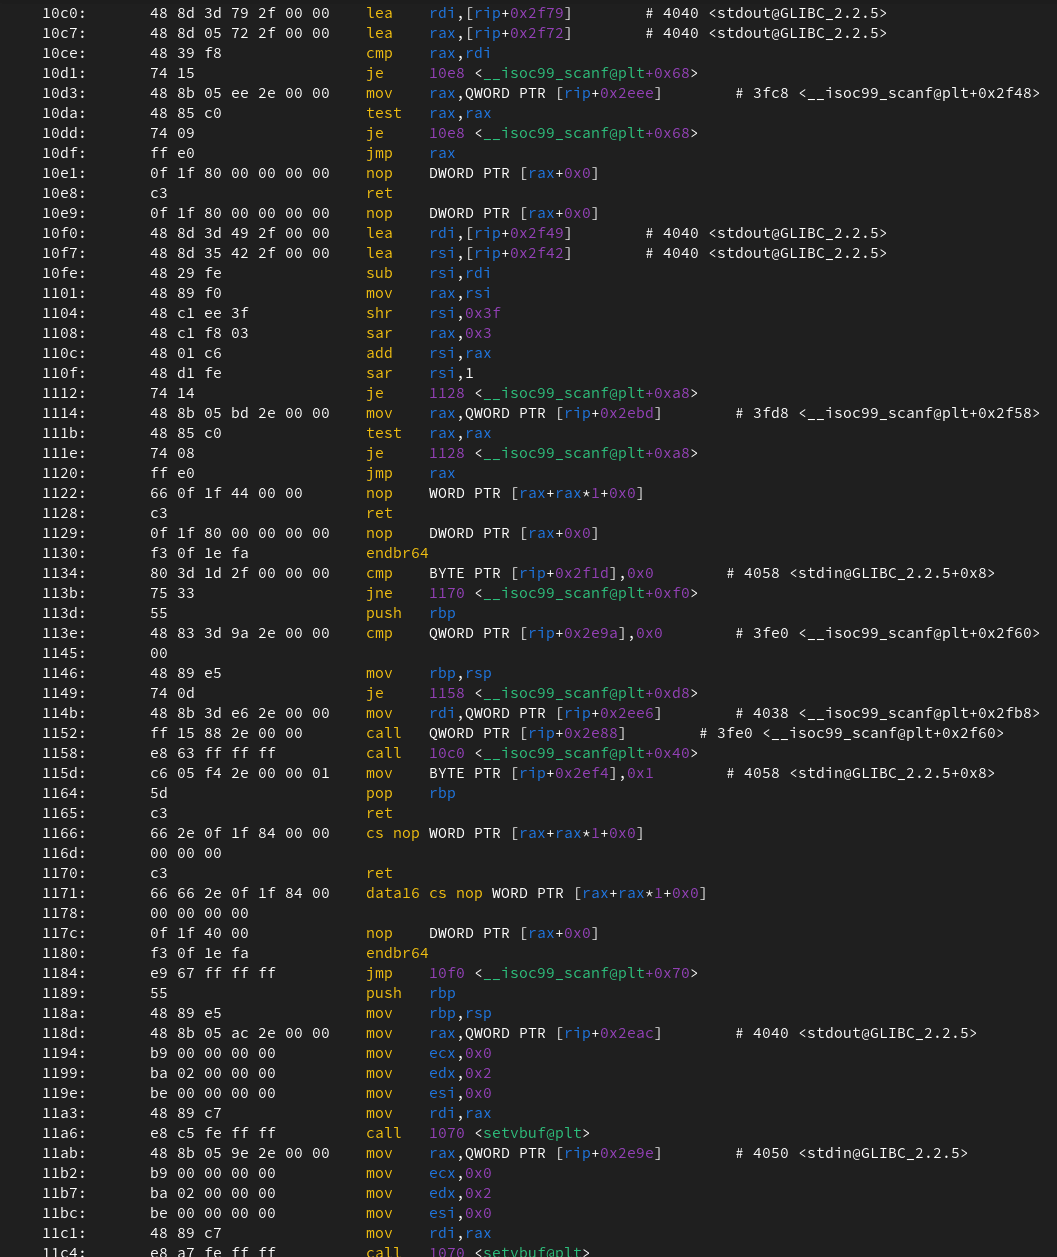
(gdb) x/20i 0x1090
   0x1090:    endbr64
   0x1094:    xor    ebp,ebp
   0x1096:    mov    r9,rdx
   0x1099:    pop    rsi
   0x109a:    mov    rdx,rsp
   0x109d:    and    rsp,0xfffffffffffffff0
   0x10a1:    push   rax
   0x10a2:    push   rsp
   0x10a3:    xor    r8d,r8d
   0x10a6:    xor    ecx,ecx
   0x10a8:    lea    rdi,[rip+0x133]        # 0x11e2
   0x10af:        call   QWORD PTR [rip+0x2f0b]        # 0x3fc0
   0x10b5:    hlt
   0x10b6:    cs nop WORD PTR [rax+rax*1+0x0]
   0x10c0:    lea    rdi,[rip+0x2f79]        # 0x4040 <stdout>
   0x10c7:    lea    rax,[rip+0x2f72]        # 0x4040 <stdout>
   0x10ce:    cmp    rax,rdi
   0x10d1:    je     0x10e8
   0x10d3:    mov    rax,QWORD PTR [rip+0x2eee]        # 0x3fc8
   0x10da:    test   rax,rax
b) objdump
objdump is a command-line utility that displays the machine code of a binary in assembly language along with its offsets.
[user@myarch Articles]$ objdump -d -M intel -j .text simple-pwn.o

simple-pwn.o:     file format elf64-x86-64


Disassembly of section .text:

0000000000001090 <.text>:
    1090:    f3 0f 1e fa              endbr64
    1094:    31 ed                    xor    ebp,ebp
    1096:    49 89 d1                 mov    r9,rdx
    1099:    5e                       pop    rsi
    109a:    48 89 e2                 mov    rdx,rsp
    109d:    48 83 e4 f0              and    rsp,0xfffffffffffffff0
    10a1:    50                       push   rax
    10a2:    54                       push   rsp
    10a3:    45 31 c0                 xor    r8d,r8d
    10a6:    31 c9                    xor    ecx,ecx
    10a8:    48 8d 3d 33 01 00 00     lea    rdi,[rip+0x133]
    10af:    ff 15 0b 2f 00 00        call   QWORD PTR [rip+0x2f0b]
    10b5:    f4                       hlt
    10b6:    66 2e 0f 1f 84 00 00     cs nop WORD PTR [rax+rax*1+0x0]
...
c) Getting offsets with a Decompiler (Ghidra)
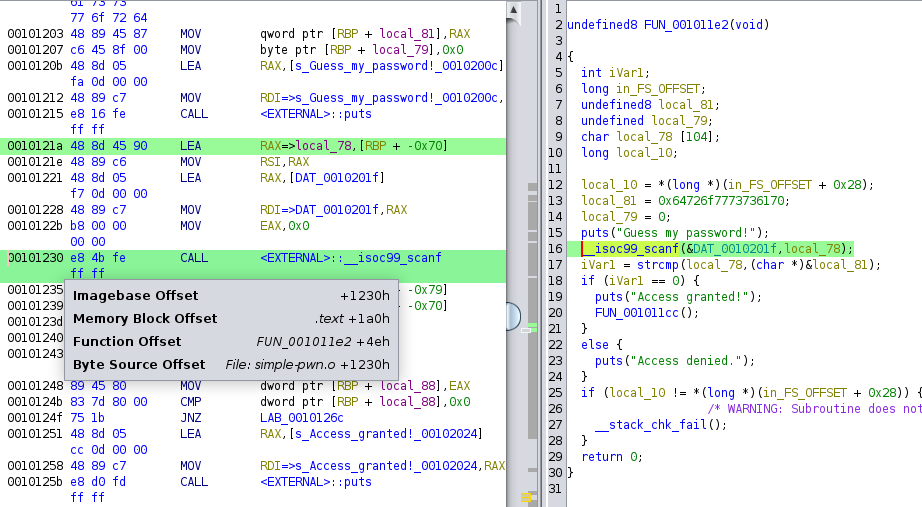
All good decompilers provide a method to determine the offset of an instruction from the base of the binary. In Ghidra, you can easily get the offset of an assembly instruction by hovering over it.

The offset we need is the 'Imagebase Offset,' which is +1230h or 0x1230.
Using the offsets
Once the offset is found, it can be added to the $BASE variable to get its runtime memory address. For example, the runtime instruction address for 'call scanf' can be found by adding its offset (0x1230) to the base address.
For help, type "help".
Type "apropos word" to search for commands related to "word"...
Reading symbols from ./simple-pwn.o...
(No debugging symbols found in ./simple-pwn.o)
(gdb) p/x $BASE + 0x1230
$1 = 0x555555555230
The address 0x555555555230 is the runtime address for the 'call scanf' instruction. This address can then be used for a breakpoint.
(gdb) b *($BASE + 0x1230)
Breakpoint 1 at 0x555555555230
(gdb) r
Starting program: /tmp/simple-pwn.o
[Thread debugging using libthread_db enabled]
Using host libthread_db library "/usr/lib/libthread_db.so.1".
Guess my password!

Breakpoint 1, 0x0000555555555230 in ?? ()
(gdb)
Addresses created by the offset and $BASE can be used for all other functions of gdb, such as call, watch, jump, etc.
Conclusion
Thanks for reading this article, I hope it is useful for you. If you have any questions you can dm me at @dingo418. If you have any other gdb tips that you think would be useful for people to know, let me know.
Credits:


